Web based time recording
Simple, efficient, web based, timesheet recording, management and analysis.
Equally important as being able to enter time efficiently is the ability to effectively analyse that time and make business decisions based on that analysis. DbNetTime offers a comprehensive range of flexible report applications that facilitate this.
Report configurations for all reports made by a user at run-time can be stored and recalled by saving them with a description as a user profile.
All the reports can be run in a "user" mode that provides all the functionality of the report applications but restricts the data available to be that of the current user.
Each of the reports are based is based on a editable HTML template file that can be modified to allow for customisations such as the addition of a company logo.
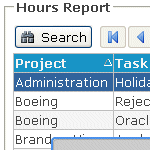
Detail Report
The Detail Report is a flexible tool for the reporting of entered time data at a individual time entry level that can be reviewed, sorted, exported, printed or copied. The report includes a powerful search dialog that allows the entered time to be filtered in virtually any way the user chooses.
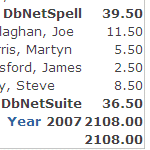
Summary Report
The Summary Report produces a summary level report of entered time data with optional sub-totaling. The user can define the columns by which the report is grouped and the order of those columns. Selected data can then be filtered, sorted, exported, printed or copied. Data can be summarised by any combination of Cost Center, Project, Task, User, Date, Week, Month, Quarter or Year.
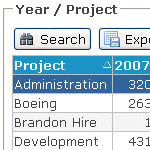
Crosstab Report
The Crosstab Report builds a matrix of summary data based on 2 user-definable axis which can be selected from Cost Center, Project, Task, User, Date, Week, Month, Quarter or Year.
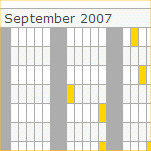
Timesheet Calendar
The Timesheet Calendar report shows allocated time in calendar format. Time allocated to selected Users, Projects or Tasks can be seen mapped over a period of up to 12 months and provides a visual "at a glance" overview of how time is being spent within an organisation. It can also be used more specifically for functions such as viewing booked holiday hours to identify possible conflicts.
Charting
Both the Crosstab Report and Summary Report have an integrated charting function that allows a user to generate a graphical representation of the selected timesheet data. The chart can be customised using a chart configuration dialog.
Profiles
All reports include the ability to save the selection criteria as a user profile which can then be used to restore a report configuration in a just a couple of mouse clicks.


